Part of: The process that only lives in your head
SOPs
ChatGPT chart analysis for business: use the new charts without trusting fake numbers
For partners and managers at small CPA and tax firms who want ChatGPT chart analysis they can trust before a chart lands in a client deck.
For partners and managers at small CPA and tax firms who want ChatGPT chart analysis they can trust before a chart lands in a client deck.
It's Thursday at 5:10. A senior puts a neat bar chart from ChatGPT into the client PDF. The bars look right. The partner skims the story, not the axis. Friday morning the client asks why Q3 revenue is $40k higher than their own P&L. The chart invented a total. GPT-6's Intelligent UI made the chart in seconds. Nobody pasted the source table or re-checked the numbers in Excel. That is ChatGPT chart analysis done the wrong way.
The short answer
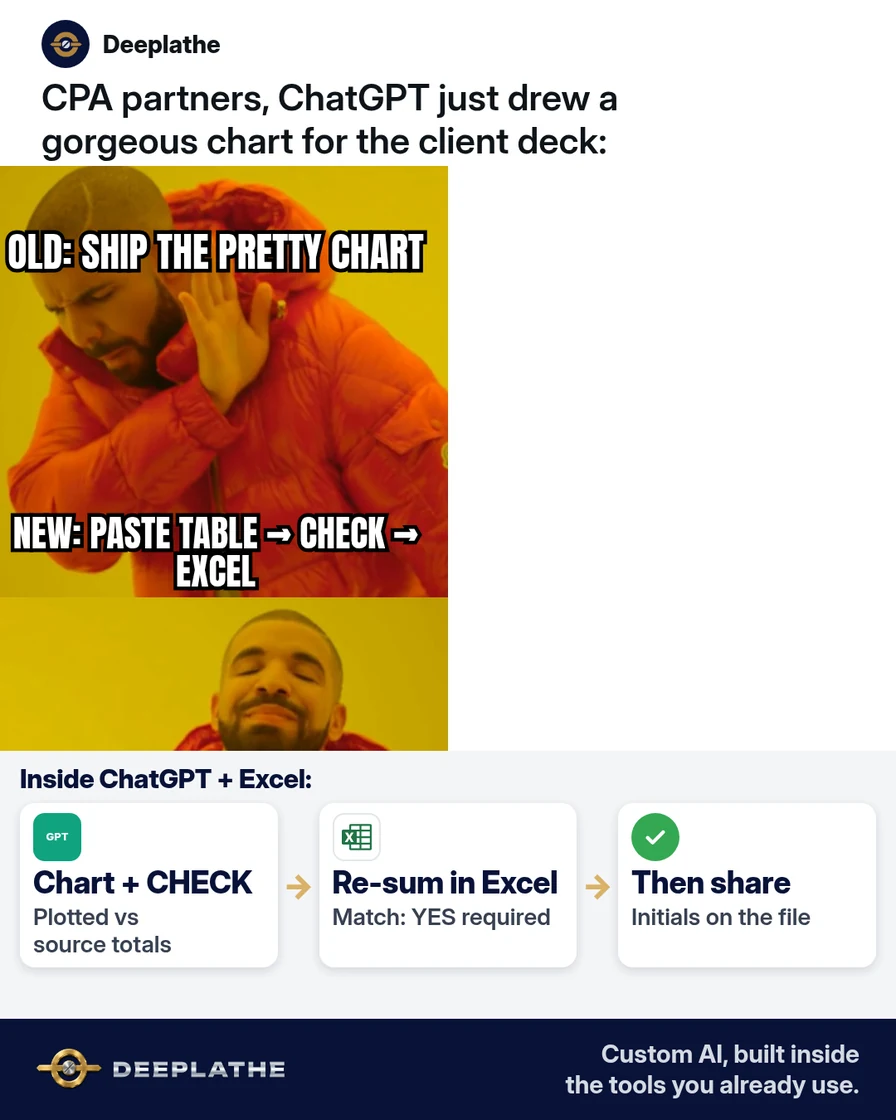
For ChatGPT chart analysis at work, paste the source table in the same chat, ask for the chart plus a row-level totals check, then re-sum the key figures in Excel or Sheets before anything leaves the firm. Pretty charts are drafts. Matching totals are the product.
Why AI charts fool busy firms
On 7 October 2026 OpenAI began rolling GPT-6 Intelligent UI in ChatGPT, including interactive charts, forms and calculators in the Chat tab for paid and then free tiers. Charts are persuasive. Partners are short on time. The model can draw a clean visual while quietly misreading a pasted CSV, dropping a row, or mixing accrual and cash. Firms already learned that chat tools invent discounts and dates; a chart is the same failure mode with better typography.
Floor vote
When did an AI chart last bite your firm?
One vote per device. Change it any time.
Loading votes…
Step 1: Start ChatGPT chart analysis from a locked source table
Export the numbers from Excel, QuickBooks, Karbon workpapers or TaxDome — CSV or a clean pasted table. In ChatGPT Business (or your firm's approved workspace), start a new chat. Paste the table first. Do not ask for a chart from a verbal description of the numbers.
You are helping a US CPA firm with chart analysis.
SOURCE TABLE (do not change any number):
[PASTE CSV OR TABLE]

Tasks:
1) Restate the column headers and row count you see.
2) Compute totals for [COLUMN NAMES] and show your arithmetic.
3) Only then propose one chart type (bar/line/pie) and why.
4) List any row that looks like a duplicate, blank, or outlier.
If a number is unclear, say [NEED] — do not guess.
Step 2: Ask for the chart and a verification block together
After the restatement looks right, ask for the visual and a verification block in one reply:
Create the chart from the SOURCE TABLE only.
Under the chart, print:
- Chart title
- Series names
- Each bar/point value as you plotted it
- Grand total of [METRIC] as plotted
Then print CHECK: "Plotted grand total = [X]. Source grand total = [Y]. Match: YES/NO."
If Match is NO, do not beautify — list the differing rows.
Save that reply. The verification block is what the reviewer reads first.
Step 3: Re-sum in Excel before the chart leaves the chat
Open the source file in Excel or Google Sheets. Use SUM / Pivot on the same metric. Compare to the CHECK line. If anything differs, fix the source or discard the chart. Never "fix" the chart by typing a number into a prompt without fixing the table.
Step 4: Label every exported chart as draft until reviewed
When you screenshot or export, add "Draft — source checked by [initials] [date]" in the file name. Client-facing decks only get charts that passed Step 3. Keep the chat link or export in the workpaper folder.
From pretty chart to checked chart
- 1PasteSource table locked in the chat.
- 2CHECKPlotted vs source totals in one reply.
- 3Re-sumExcel or Sheets confirms Match: YES.
- 4LabelDraft until initials and date.
- Export first: Locked CSV/table from Excel or the workpaper.
- Chart + CHECK: ChatGPT plots and prints plotted vs source totals.
- Re-sum: Excel/Sheets confirms Match: YES.
- Label: Draft until initials and date are on the file.
Example (illustrative): 12-person multi-office tax firm
A manager uses ChatGPT Business for a partner's Q3 fee mix chart. She pastes the fee CSV, runs the prompt pack above, catches a Match: NO on one office (a voided invoice still in the export), fixes the CSV, re-runs, and only then drops the chart into the partner deck.
At a glance
- Problem: Client-ready charts from ChatGPT without a source check.
- What was set up: Paste-table → chart+CHECK → Excel re-sum → draft label.
- Tools it lives in: ChatGPT Business, Excel or Sheets, Karbon or TaxDome workpapers.
- What the owner still does: Partner or manager initials the check.
- Payoff: not measured here — track "charts rejected at CHECK" for a month.
Timing that keeps this from slipping
Block fifteen minutes on the calendar the same day you touch this job. Put it next to an existing habit (morning inbox, end-of-day close, Monday ops meeting). The fix above fails when it is "someday." It works when it is a named slot with a named owner. If you miss two days in a row, restart with the shortest step only — usually the checklist or the five facts — before you open a new AI chat.
What "good enough" looks like after one week
After five chart checks, you should have a short folder of chats where Match: YES appears before every export. Partners stop asking "is this from Excel or from the bot?" because the filename already says who initialled the CHECK. If Match: NO still shows up often, the problem is usually the export (voided rows, two bases mixed), not the model. Fix the CSV once; the prompt pack stays the same. That is how ChatGPT chart analysis becomes a habit instead of a scare.
Mistakes to avoid
- Asking for a chart from a description. No table, no chart.
- Trusting Interactive UI calculators blindly. Same CHECK rule.
- Letting AI invent missing months. Use [NEED].
- Putting client identifiers in a personal ChatGPT account. Use the firm workspace; strip SSNs and account numbers first.
- Skipping Excel because the chart "looks right."
Field check
Field check
Three questions. Honest answers. No score sent anywhere but this page.
01 / 03
What must you paste before asking for a chart?
Owners often ask whether they should wait for a perfect setup. Do not. Ship the smallest version that keeps a human in the loop: one checklist, one prompt, one calendar block. You can widen the workflow after a quiet week. Waiting for a vendor feature rename or a perfect SOP is how October becomes December with the same pile. The version in this article is enough to start today on the tools you already pay for.
If it still doesn't work
If ChatGPT can't read your paste, upload CSV or split the table. If Intelligent UI isn't on your workspace yet, use the same CHECK flow with a markdown table and build the chart in Excel. If the file is client-confidential under engagement terms, keep it offline and chart in Excel only.
Doing this inside the tools you already use
Deeplathe builds custom AI inside the tools a tax firm already uses — Excel, Outlook, Karbon or TaxDome — so chart checks and draft decks follow your workpaper rules, with you approving anything client-facing. Less than a hire, more output, from a shoe store to a law firm. If you want that wired once, see /solutions.
FAQ
What is ChatGPT chart analysis?
Using ChatGPT (including GPT-6 Intelligent UI charts) to visualise a dataset you provide, then checking that every plotted value matches the source.
Does GPT-6 make charts accurate automatically?
No. Interactive charts are still model output. You verify.
How do I verify chatgpt answers that include a chart?
Require a CHECK block (plotted vs source totals) and re-sum in Excel.
Can I use a free ChatGPT account for client data?
Prefer the firm's Business/Enterprise workspace and strip private identifiers. Follow your engagement letter.
Should the chart live in Excel instead?
Often yes for final delivery. Use ChatGPT to explore; ship from Excel after CHECK.
Keep these
- Table first, chart second.
- CHECK block every time.
- Excel re-sum before share.
- Initials on the draft.
Sources
Related reading
Keep these
The working rules
For ChatGPT chart analysis at work, paste the source table in the same chat, ask for the chart plus a row-level totals check, then re-sum the key figures in Excel or Sheets before anything leaves the firm.